Development of plasmon-resonance of metal nanoparticles enhanced harmonic generation in nonlinear medium
-
摘要: 随着纳米加工和制备技术的不断发展,金属纳米粒子的等离激元光学特性已得到了广泛的研究与应用。本文基于金属纳米颗粒等离激元共振特性,分析了金属纳米颗粒等离激元共振对介质谐波的增强机制,综述了该增强机制在近几年所取得的最新研究成果及其在生物成像领域的应用。金属纳米颗粒等离激元共振在增强介质非线性特性领域的发展趋势是从简单的金属纳米颗粒向复杂形状纳米颗粒和金属纳米颗粒组装体的发展,这些新型金属纳米颗粒在非线性光学、生物医学上的疾病诊断和治疗有良好的实际应用前景。Abstract: With the development of nano-processing and preparation techniques, the characteristics of plasmon optics of metal nanoparticles have been widely studied and applied. Based on metal nanoparticles plasmon-resonance characteristics, the article introduces metal nanoparticles plasmon-resonance enhanced harmonic generation in nonlinear media, and reviews the research results of harmonic generation and biological harmonic imaging applications in recent years. The trend of plasmon-resonance of metal nanoparticles enhanced harmonic generation in nonlinear medium is that the metal nanoparticles range from simple metal nanoparticles to metal nanoparticles with complex shape and assembly. The novel metal nanoparticles have a good practical application in the field of nonlinear optics, biomedical diseases diagnosis and treatment.
-
Key words:
- plasmon /
- plasmon resonance /
- second harmonic generation /
- third harmonic generation /
- harmonic imaging
-
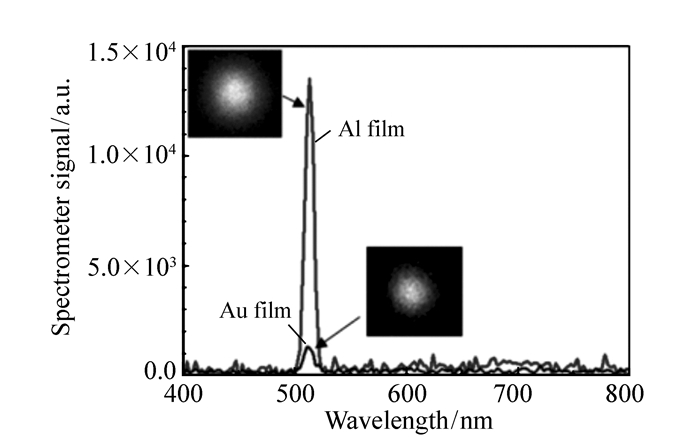
图 1 铝膜和金膜THG的发射光谱,激发激光波长为1 560 nm。插图是THG形成的二维光斑图像,光斑直径为4.3 μm[23]
Figure 1. THG emission spectra from Al and Au films.Excitation laser wavelength 1 560 nm. The insets show two-dimensional optical images formed by THG radiation,with exciting laser radiation focused into a spot of 4.3 μm in diameter[23]
图 2 铝狭缝(50 nm×50 nm×170 nm)在两种电场偏振态下产生的THG信号:左图电场偏振方向垂直狭缝的长轴;右图电场偏振方向平行狭缝的长轴
Figure 2. Third-harmonic generation from a slit of size 50 nm×170 nm made in an aluminum film 50 nm thick with two different polarizations of radiation: left column-polarization is directed across the long axis of the slit; right column-polarization along the long axis
图 3 (a)、(b)分别为只有100 nm金胶体、混合40 nm和100 nm的金胶体在脉冲1 500 nm激光下的THG的峰值强度;(c)(d)分别为只有100 nm金胶体、混合40 nm和100 nm的金胶体在不同激光强度作用下的光栅扫描图像[24]
Figure 3. Histograms of the peak intensities above background for a pure 100-nm sample and (b)the 40-nm colloids of a mixed sample; (c)(d) Raster-scanned image of a mixture of 40-nm and 100-nm gold colloids. The same scan is shown with two different laser intensity scalings[24]
图 4 (a)、(b)为入射光偏振方向沿金/银纳米棒和金/银纳米梭纵向的局部场FDTD模拟分布图,网格的尺寸为0.2 nm,图(c)为入射光偏振方向沿两种纳米颗粒长轴方向的LSP峰值和场增强,图(d)为实验得到的三阶非线性极化率χ(3)随激发波长的变化关系[25]
Figure 4. Resonant enhancement of local fields obtained from FDTD calculations of the averagely sized Au NR(a) and Au/Ag nanoshuttle(b) at a mesh size of 0.2 nm. (c)Electric field enhancement profiles along the longitudinal direction for (a)Au NR and (b)Au/Ag nanoshuttle. The origin is at their centers. They are excited at their respective LSP peak wavelengths and polarization parallel to the long axis; (d) The value of χ(3) vs the excitation wavelength[25]
图 5 (a)反射式光学系统图;(b)实验测得的Au三角纳米颗粒阵列线性反射光谱(实线),以及模拟计算的Au三角周期阵列的电场能量分布和电流分布;(c)不同激发波长照射下的THG信号,实心方块为实验测量值,虚线为拟合曲线[26]
Figure 5. (a)The diagram of reflective optical system; (b)the experiment of triangular Au nanoparticles array linear reflectance spectra(solid line),as well as the simulation of Au triangular periodic array of electric field energy distribution and the current distribution; (c)the THG signal of different excitation wavelength irradiation,solid squares for experimental measurement value,dotted line for the fitting curve[26]
图 6 利用FDTD模拟局域场增强(a)局域场增强时金纳米蝴蝶结产生高次谐波的示意图,入射光的偏振方向沿x-z平面,(b)(c)模拟得到同一纳米结构不同面x-y和x-z视图的场增强分布[27]
Figure 6. Finite-difference time-domain simulation of local field enhancement. (a)The diagram of local field enhancement for simulation of a single Au bow-tie element with high harminic generation . The polarization direction of the incident pulse parallel to the x-z plane.(b)Intensity field computed in the x-y plane. (c)Same simulation result viewed in the x-z plane[27]
图 7 (a)为采用薄膜拉伸法制备出定向排列的Au NRs阵列薄膜的示意图;(b)未定向排列的Au NRs薄膜(用Original表示)和定向排列的Au NRs阵列薄膜(用Stretched表示)在不同偏振光激发下的光学显微成像图;(c)未定向排列的Au NRs薄膜和定向排列的Au NRs阵列薄膜被不同偏振方向的入射光激发后的吸收系数;(d)定向排列的Au NRs阵列被不同偏振方向的入射光激发后的吸收系数,图中分别为理论计算值(Calculated)与实验测量值(Measured)[28]
Figure 7. (a)Schematic diagram of the stretched-film process. (b)Optical microscopy images of the original and stretched film under white light illumination with polarization parallel and perpendicular to the stretch direction. (c)Measured absorbance spectra of the Au NRs/PVA films. Spectra were normalized and vertically shifted for clear display. (d)Measured absorbance spectra of another stretched Au NRs/PVA film under excitation polarized parallel and perpendicular to the stretch direction. Solid lines are the corresponding calculations of a single Au NR[28]
图 8 Al-ZnO衬底及Al-ZnO衬底上不同粒径Au NPs的FE-SEM图片
Figure 8. FE-SEM images of AuNP-attached Al-ZnO substrates. (A)Base Al-ZnO,(B)5-nm,(C)10-nm,(D)20-nm AuNPs were chemically attached using APTMS on the Al-ZnO substrates[31]
图 9 APTMS/AZO衬底及附着不同粒径(20 nm,10 nm,5 nm)Au NPs的衬底,通过基频波为1 540 nm脉冲10 ns的激发的THG信号[31]
Figure 9. Pump-probe dependence of the third harmonic generation for the 10 ns Er:glass laser for the fundamental frequency 1 540 nm. The samples indicated as APT MS/AZO correspond to the base.Al-ZnO; samples APT MS/AZO-(20 nm,10 nm,5 nm) correspond to the samples with the attached NP of the corresponding sizes[31]
图 13 对比CdS QDs和Ag NPs-CdS QDs的SHG信号强度,灰色符号显示CdS QDs样品的SHG信号,而黑色的符号显示为混合Ag NPs-CdS QDs样品的SHG信号。虚线标志着等离子体共振最强的光谱位置[33]
Figure 13. SHG signal intensity of CdS QDs and Ag NPs-CdS QDs,gray symbols show the SHG for the QD sample,while the black symbols show the SHG for the mixed NP-QD sample.The dotted line marks the spectral position of the maximum of the plasmon resonance[33]
图 15 (a~d)中显示结合金纳米笼复合结构的前列腺癌细胞(LNCaP)(a)和正常皮肤细胞(HaCaT)(c)的SHG图像,以及未结合金纳米笼复合结构的前列腺癌细胞(LNCaP)(b)和正常皮肤细胞(HaCaT)(d)的明场图像。图(e)、(f)为结合A9-RNA(抗肿瘤适体药物)的金纳米笼复合结构进入LNCaP细胞和HaCaT细胞的TEM图。图(g)、(h)为结合A9-RNA前后的金纳米笼复合结构进入LNCaP细胞的双光子发光图像和明场图像[34]
Figure 15. (a)SHG images of nanocage assembly-attached LNCaP human prostate cancer cells,after cells were separated from unbound nanocage assemblies. The SHG signal from the nanocage assembly-attached LNCaP was detected at 480 nm. (b)Bright-field image of the same LNCaP cells after separation. (c)Normal skin HaCaT cell SHG images after separation from unbound nanocage assemblies. (d)Bright-field image of the same cells after separation. (e)TEM image of LNCaP cells after separation from unbound nanocage assemblies. Inset: zoom-in of area indicated by arrow. The low magnification image clearly shows that nanocage assemblies are attached to the LNCaP cells. Scale bar:1 mm. (f)TEM image of HaCaT cells after unbound nanocage assembly separation. Scale bar:1 mm. (g)Two-photon luminescence images of nanocage assembly-attached LNCaP human prostate cancer cells,after cells were separated from unbound nanocage assemblies. (h)Bright-field image of the same LNCaP cells after separation[34]
-
[1] [2] [3] [4] [5] [6] [7] [8] [9] [10] [11] [12] [13] [14] [15] [16] [17] [18] [19] [20] [21] [22] [23] [24] [25] [26] [27] [28] [29] [30] [31] [32] [33] [34] -


 下载:
下载:


